It’s no secret that the condo suites going up across Toronto are typically turned over to renters. In the second quarter of the year, the Toronto Real Estate Board (TREB) counted a total of 5,569 condo apartment rentals in the 416 alone, up 19.5 per cent from the same time last year. The total number of listings also increased by 15.1 per cent to 9,468.
Taking the longview, the total amount of condo leases in the City of Toronto increased by 49.2 per cent in just two years and the number of listings rose by 41.9 per cent.
We thought we’d zero in on neighourhoods to get a better picture of the market. Compared to TREB’s West and East regions, the Central region was by far the busiest, accounting for 4,505 or a whopping 80.9 per cent of all the condo rentals in the city last quarter and just over 60 per cent of all the rentals throughout the GTA.
No surprise here: the three biggest rental markets within the entire city were in the Central region along the Yonge-University subway line. The C01 district counted 3,927 total listings, C08 recorded 95, followed closely by C14, which saw 985 (see map below to see the district locations).
Here are some other fascinating stats going back two years:
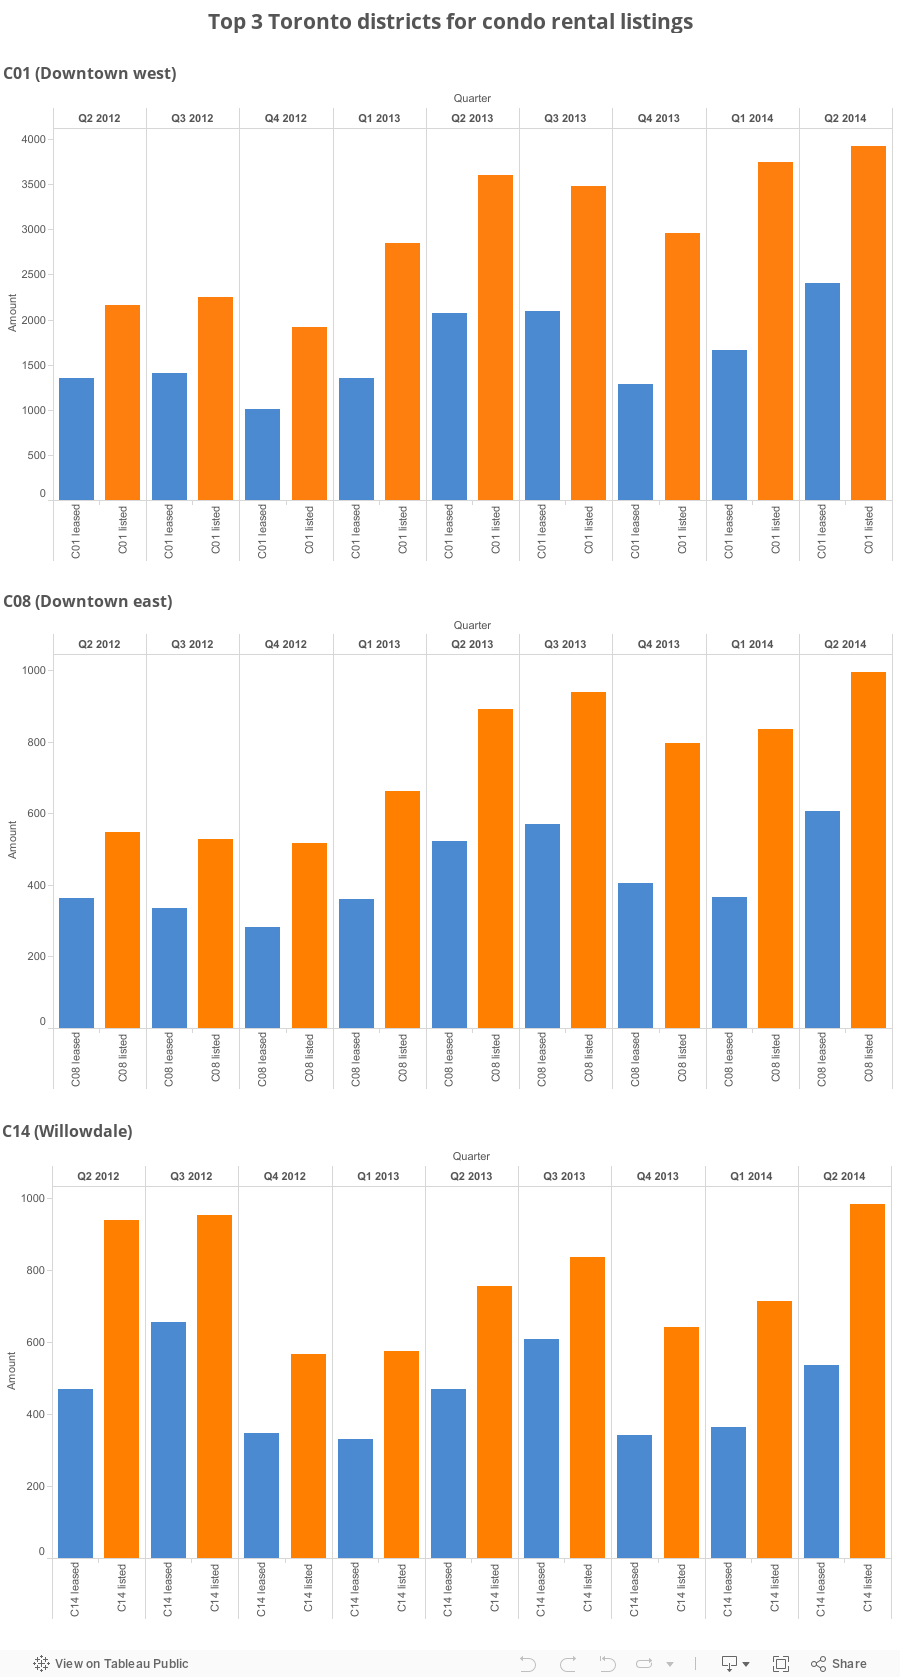
- C01, which stretches from the core to the western neighbourhoods such as Liberty Village, saw listings increase by 9.1 per cent between Q2 2013 and Q2 2014 while leases increased by 16.3 per cent. However, if you compare the last quarter to Q2 2012, listings rose by a dramatic 81.8 per cent and leases jumped by 78.5 per cent.
- In the downtown eastside, or C08, the total amount of listings in the second quarter rose 11.5 per cent, year-over-year, while leases increased by 16.1 per cent. Like in C01, the change in the past two years was much more significant with listings surging by 81.9 per cent and leases spiking by 66.9 per cent.
- That trend was reversed up in Willowdale: the C14 district saw listings increase by 30.5 per cent from last year and leases rise by 14 per cent. The change from 2012 was more modest with a 4.8 per cent in listings and 14.5 per cent leases.
For more details, check out our map and the quarterly results by district, going all the way back to 2012: